Intro
The goal of this usability study was to evaluate the first-time user experience of SMART lab, an application developed by SMART Technologies that helps teachers build game-based activities for use in their classrooms.
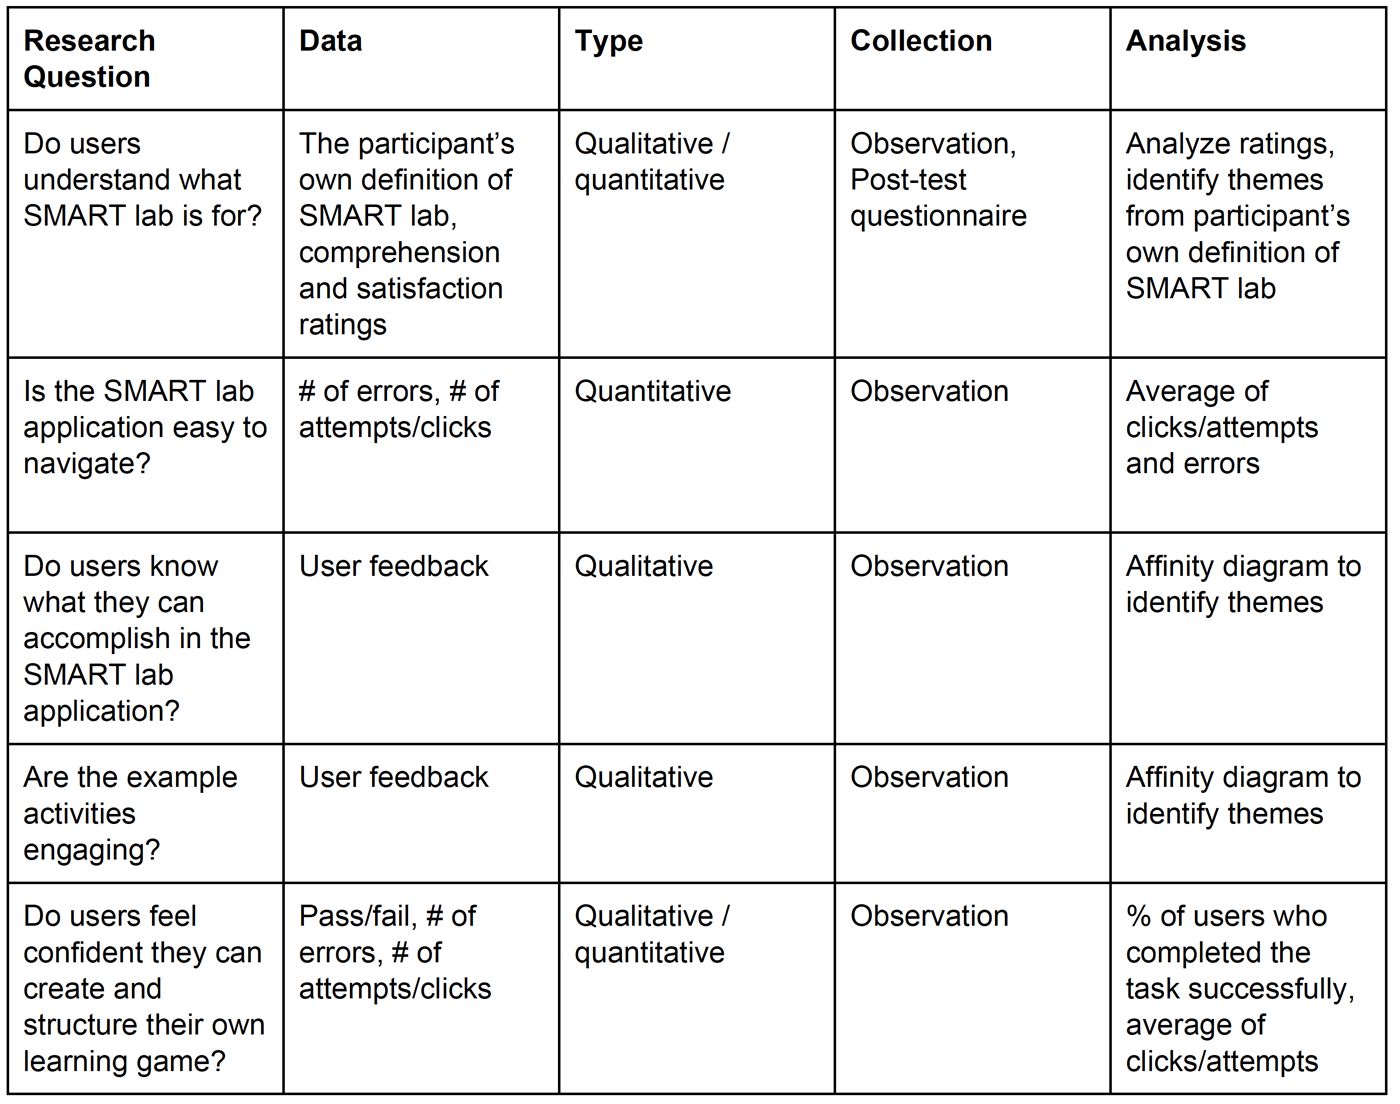
Our study focused on four areas:
- Ease of use of SMART lab
- Comprehension
- Engagement of participants with the application
- Likelihood of use in the classroom
Process
Heuristic Evaluations
Our team conducted heuristic evaluations where we evaluated two versions of SMART lab: interactive whiteboard and desktop/mobile. Our group used a customized, proprietary spreadsheet based on seven of Jakob Nielsen’s ten general principles for interaction design:
- Visibility of System Status
- Match Between System and Real World
- Learnability
- Consistency and Standards
- Error Prevention and Recovery
- Flexibility and Efficiency
- Recognition vs Recall
Each of the seven guidelines in the evaluation spreadsheet also had a section to enter frequency of occurrences for specific observations such as “It is always clear what is happening…”.
After completing the heuristic evaluations of the whiteboard application, all four group members conducted individual evaluations of the website application in desktop and mobile devices, using the same spreadsheet guidelines and ratings mentioned above. We combined our results into an executive summary of key findings and evaluation numbers.
Moderated User Testing
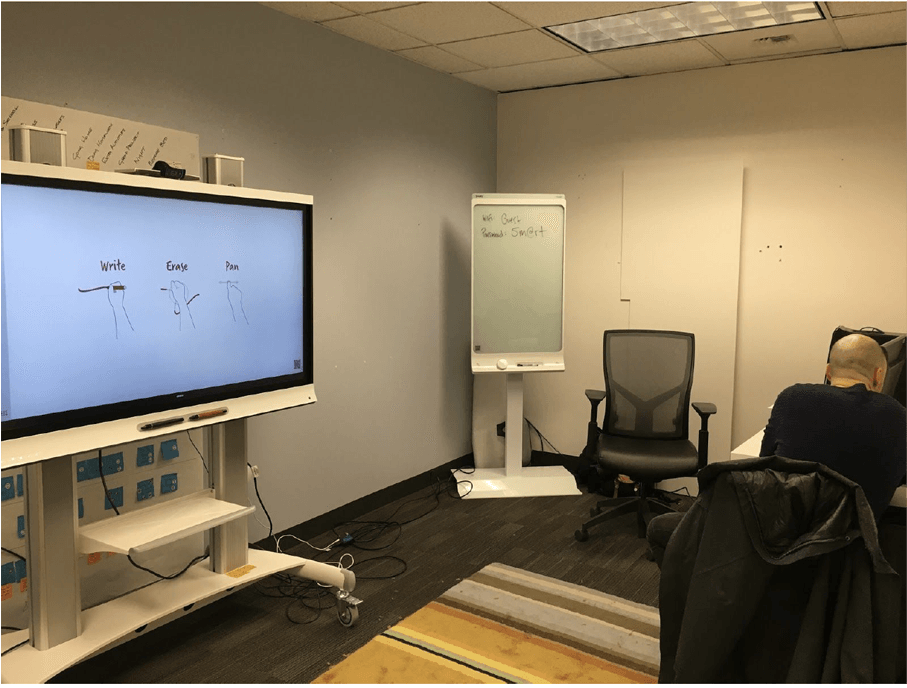
For the moderated user testing, we scheduled 30-minutes sessions with teachers from local elementary and middle schools. We collected both quantitative and qualitative data in these sessions. Each participant was asked to perform four tasks:
- Interacting with the whiteboard
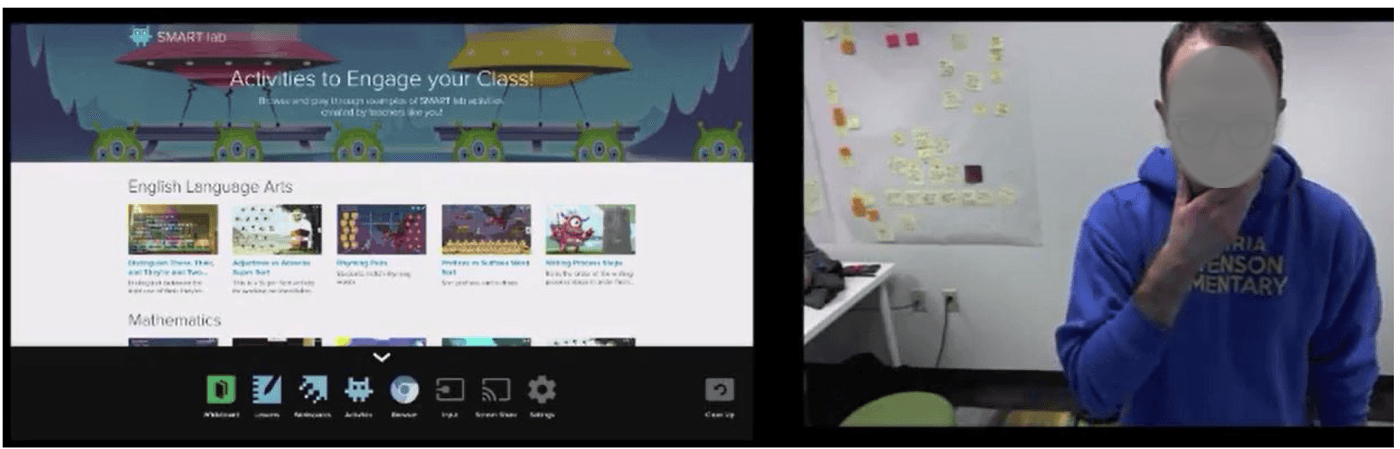
- Finding the menu and activities section
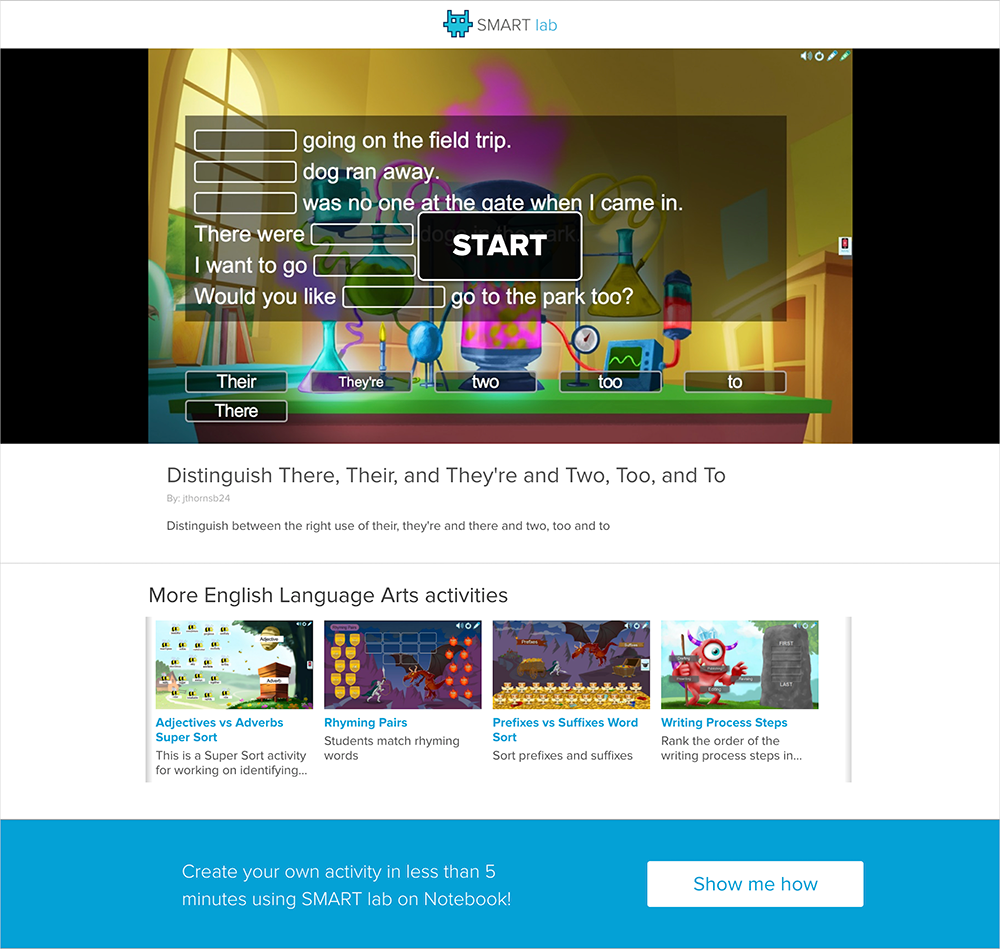
- Playing a game
- Finding out how to create their own game
At the end of the session, the participants were given a post-test questionnaire to complete by hand.
Data Collection
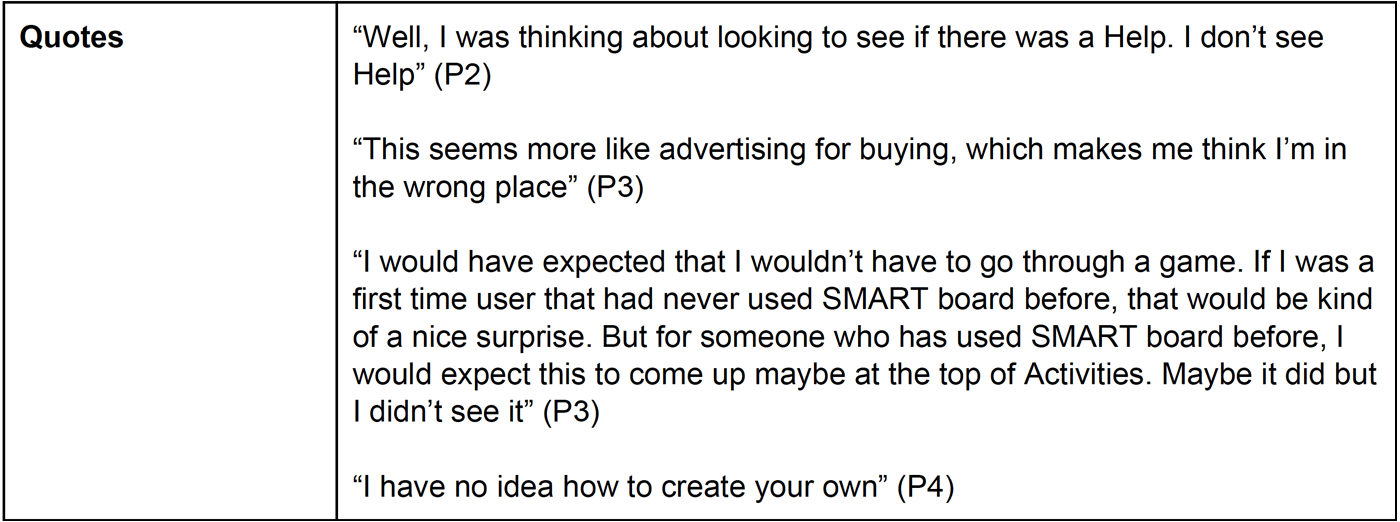
Qualitative data came from behaviors and comments expressed by the participants during testing, note-taker observations, and reviews of the recorded sessions. The team created summaries from the observations and notes of each usability testing session and documented recurring themes in a spreadsheet. We then reviewed the session videos for quotes to support our interpretations.
Quantitative data included task completion rates logged during the sessions, questionnaire data gathered after the session which asked them to rate satisfaction levels and perceptions on a 5-point Likert scale, and the measurements from our heuristic evaluation reports.
Findings and Recommendations
The goal of our study was to evaluate the first-time user experience of the SMART lab application. We identified eight findings that were categorized into three main themes. We assigned a severity rating to each of these findings using the same severity scale that our client uses, so the outcome is consistent and comparable to previous studies and research that they have conducted.
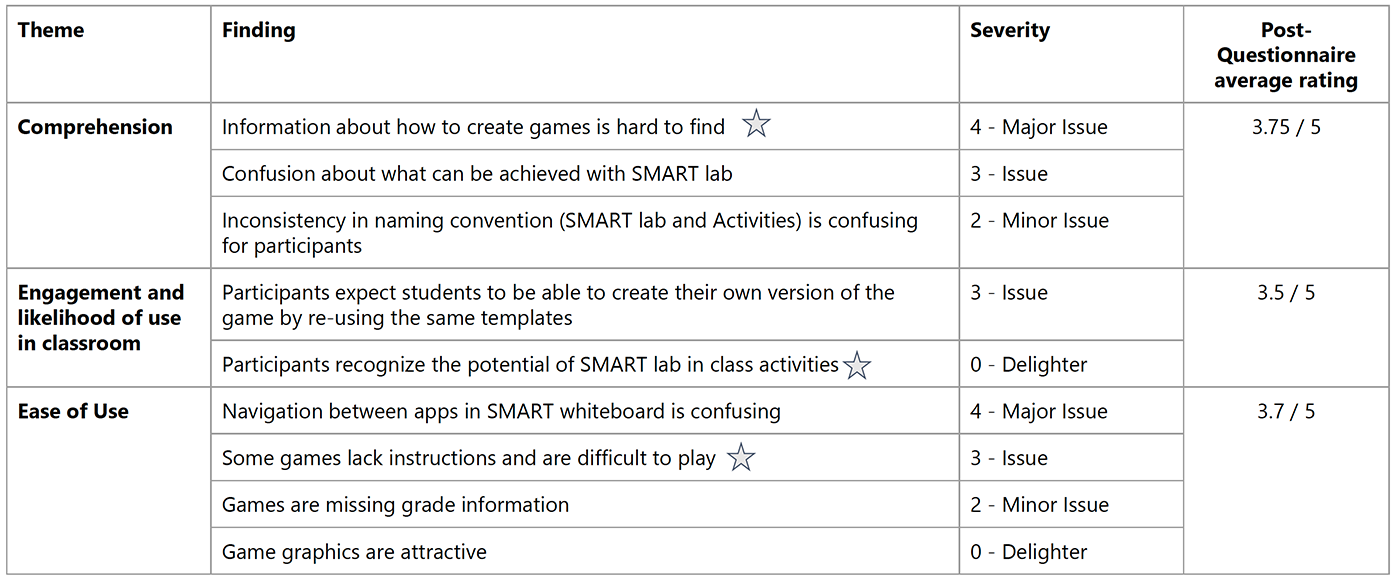
These findings along with our recommendations were presented to the client in a final report.